So I had this Python script that I wanted to bundle up in a binary to distribute to Windows systems. It worked fine when run with the Python interpreter, but was throwing a strange error after being compiled by Py2Exe:
Traceback (most recent call last):
File "download_random_files.py", line 2, in <module>
File "requests\__init__.pyc", line 58, in <module>
File "requests\utils.pyc", line 25, in <module>
File "requests\compat.pyc", line 7, in <module>
ImportError: cannot import name chardet
Which I thought was interesting, cause I had no clue what chardet was.
If you're an astute observer, you'll read the rest of the error message.. :P
Ok, so it's related to the requests package, so what? That was pretty much where the trail ended for me, all the troubleshooting I found online was only *loosely* related to my error.
Basically, the issue is in the py2exe setup.py file.
My initial setup.py file was basically just...
from distutils.core ipmort setup
import py2exe
console=['controller.py']
Which isn't taking advantage of any of the features of py2exe. After some digging, I found a quick and dirty solution. For some reason, py2exe was having problems locating the requests package, which was necessary for the script to run. I found that by explicitly specifying the requests package in my setup file, the issue corrected itself.
from distutils.core import setup
import py2exe
setup(
console=['controller.py'],
options = {'py2exe': {'packages': ['requests']}})
With that said, there are some really cool options/features you can add when you convert your python to a binary. Check them all out at: http://www.py2exe.org/index.cgi/ListOfOptions
Just another shm00's blog
The journey of one shmoo.
Wednesday, July 2, 2014
Tuesday, May 27, 2014
I found this SQL post so awesome that I wanted to mirror it here so it doesn't go away. Really nice explanation of indices in SQL Server.
Source: http://www.mssqltips.com/sqlservertip/1206/understanding-sql-server-indexing/
Author: Greg Robidoux
Problem
With so many aspects of SQL Server to cover and to write about, some of the basic principals are often overlooked. There have been several people that have asked questions about indexing along with a general overview of the differences of clustered and non clustered indexes. Based on the number of questions that we have received, this tip will discuss the differences of indexes and some general guidelines around indexing.
With so many aspects of SQL Server to cover and to write about, some of the basic principals are often overlooked. There have been several people that have asked questions about indexing along with a general overview of the differences of clustered and non clustered indexes. Based on the number of questions that we have received, this tip will discuss the differences of indexes and some general guidelines around indexing.
SolutionFrom a simple standpoint SQL Server offers two types of indexes clustered and non-clustered. In its simplest definition a clustered index is an index that stores the actual data and a non-clustered index is just a pointer to the data. A table can only have one Clustered index and up to 249 Non-Clustered Indexes. If a table does not have a clustered index it is referred to as a Heap. So what does this actually mean?
To further clarify this lets take a look at what indexes do and why they are important. The primary reason indexes are built is to provide faster data access to the specific data your query is trying to retrieve. This could be either a clustered or non-clustered index. Without having an index SQL Server would need to read through all of the data in order to find the rows that satisfy the query. If you have ever looked at a query plan the difference would be an Index Seek vs a Table Scan as well as some other operations depending on the data selected.
Here are some examples of queries that were run. These were run against table dbo.contact that has about 20,000 rows of data. Each of these queries was run with no index as well as with a clustered and non-clustered indexes. To show the impact a graphical query plan has been provided. This can be created by highlighting the query and pressing Control-L (Ctrl-L) in the query window.
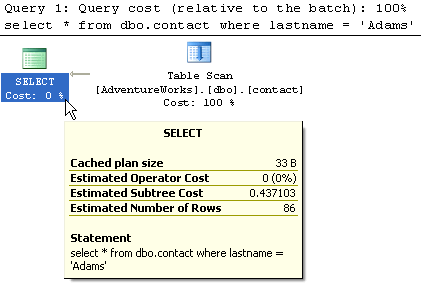
1 - Table with no indexesWhen the query runs, since there are no indexes, SQL Server does a Table Scan against the table to look through every row to determine if any of the records have a lastname of "Adams". This query has an Estimated Subtree Cost of 0.437103. This is the cost to SQL Server to execute the query. The lower the number the less resource intensive for SQL Server.
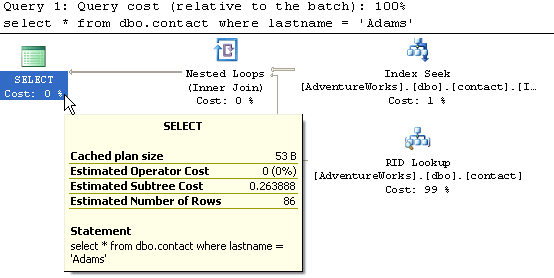
2- Table with non-clustered index on lastname columnWhen this query runs, SQL Server uses the index to do an Index Seek and then it needs to do a RID Lookup to get the actual data. You can see from the Estimated Subtree Cost of 0.263888 that this is faster then the above query.
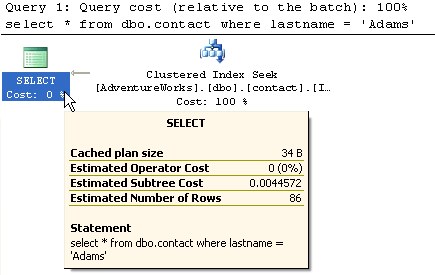
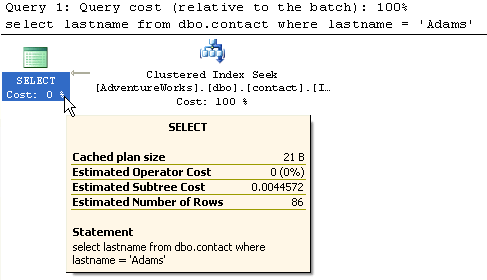
3- Table with clustered index on lastname columnWhen this query runs, SQL Server does an Index Seek and since the index points to the actual data pages, the Estimated Subtree Cost is only 0.0044572. This is by far the fastest access method for this type of query.
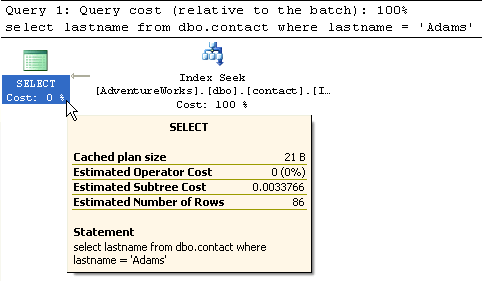
4- Table with non-clustered index on lastname columnIn this query we are only requesting column lastname. Since this query can be handled by just the non-clustered index (covering query), SQL Server does not need to access the actual data pages. Based on this query the Estimated Subtree Cost is only 0.0033766. As you can see this even better then example #3.
To take this a step further, the below output is based on having a clustered index on lastname and no non-clustered index. You can see that the subtree cost is still the same as returning all of the columns even though we are only selecting one column. So the non-clustered index performs better.
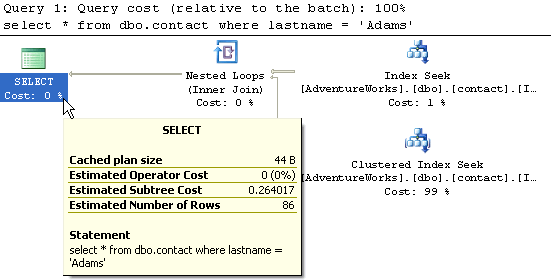
5- Table with clustered index on contactId and non-clustered on lastname columnFor this query we now have two indexes. A clustered and non-clustered. The query that is run in the same as example 2. From this output you can see that the RID Lookup has been replaced with a Clustered Index Seek. Overall it is the same type of operations, except using the Clustered Index. The subtree cost is 0.264017. This is a little better then example 2.
So based on these examples you can see the benefits of using indexes. This example table only had 20,000 rows of data, so this is quite small compared to most database tables. You can see the impact this would have on very large tables. The first idea that would come to mind is to use all clustered indexes, but because this is where the actual data is stored a table can only have one clustered index. The second thought may be to index every column. Although this maybe helpful when querying the data, there is also the overhead of maintaining all of these indexes every time you do an INSERT, UPDATE or DELETE.
Another thing you can see from these examples is ability to use non-clustered covering indexes where the index satisfies the entire result set. This is also faster then having to go to the data pages of the Heap or Clustered Index.
To really understand what indexes your tables need you need to monitor the access using a trace and then analyze the data manually or by running the Index Tuning Wizard (SQL 2000) or the Database Engine Tuning Advisor (SQL 2005). From here you can tell whether your tables are over indexed or under indexed.
Wednesday, March 26, 2014
Splunk - Basic Custom Search Command Example
Basic Custom Search Command Example(s)
Executing an arbitrary shell script w/o parameters
For this exercise, we will be executing a very basic script with no Splunk parameters. The purpose of this is to execute a python/shell script. You could just execute a shell script directly, but in the likely chance that you will eventually pass data/query, I'm using Python to execute a shell script.
- Create your test script in /$SPLUNKHOME/etc/apps/<appname>/bin/test.py
- Example test.py code:
import osos.system("(cd /splunkscripts/; ./test.sh)")
- This navigates to a directory I created at the root directory called "splunkscripts" where I house all of the various scripts I use related to Splunk. It then executes test.sh.
- Example test.sh code:
echo "This is a successful test." > splunktest.txt
- This will echo this "Hello World" test to splunktest.txt.
- Make sure both scripts (test.py and test.sh) are executable via chmod (i.e. chmod 755 )
- Edit your /$SPLUNKHOME/etc/apps/<appname>/local/commands.conf with the following:
[shelltest]
type = python
filename = test.py
generating = false
streaming = false
retainsevents = false
- Note: Generating/Streaming/Retainsevents all default to false, but for real world uses you will likely end up generating results. Be aware of these. Read the Splunk docs on custom searches as well: http://docs.splunk.com/Documentation/Splunk/latest/Search/Customsearchcommandexample
- Restart Splunk.
- Go to your appropriate Splunk app where you stored this script and search: | shelltest
- Navigate to /splunkscripts/ and see if your test.sh wrote out the data to the splunktest.txt.
- If you get an "Error Code 1", then there is an issue with your Python/Shell code.
Tuesday, February 19, 2013
Splunk SDK for Python - Connecting to Splunk
I am going to try and cover my experience with the Splunk documentation here.
Connecting to Splunk via .py
If you have just installed the Splunk SDK for Python and you want to know how to connect to Splunk in the Python interpreter or through a python script, this is for you.
I used the saved_searches.py example as a starting place to see how python connects to Splunk.
Step 1) Use your preferred editor to modify ~/.splunkrc to contain your corresponding username, password, port and other configuration settings.
Note: "Storing login credentials in the .splunkrc file is only for convenience during development—this file isn't part of the Splunk platform and shouldn't be used for storing user credentials for production. And, if you're at all concerned about the security of your credentials, just enter them at the command line and don't bother using the .splunkrc file."
Step 2) Once you have that, test to make sure your authentication is correct by using the Splunk-Python interpreter located in the /examples/ folder:
$ python spcmd.py
Welcome to Splunk SDK's Python interactive shell
admin connected to localhost:8089
>
If you can successfully connect there without passing any credentials at the command line than your .splunkrc file is set up correctly and you can continue.
Step 3) Use your preferred editor to create a .py file.
Step 4) I used the saved_searches.py example as a template:
import sys, os
sys.path.insert(0, os.path.join(os.path.dirname(__file__), ".."))
from splunklib.client import connect
try:
from utils import parse
except ImportError:
raise Exception("Add the SDK repository to your PYTHONPATH to run the examples "
"(e.g., export PYTHONPATH=~/splunk-sdk-python.")
def main():
opts = parse(sys.argv[1:], {}, ".splunkrc")
service = connect(**opts.kwargs)
for app in service.apps:
print app.name
if __name__ == "__main__":
main()
Step 5) chmod 755 that .py file and execute it with: python filename.py
It should display all the installed apps on your Splunk instance.
If it gives an error but you've already added PYTHONPATH to your splunk-sdk-python, try moving the .py file to a different folder. I store mine in ~/splunk-splunk-sdk-python/scripts/.
This is a brief example on how I connected to Splunk with Python. If you have a better way to do it, please share in the comments!
Thursday, February 14, 2013
Splunking SSH failures
If your SSH logs look like this:
Feb 14 22:35:49 foo-chassis66-blade66 sshd[31513]: pam_unix(sshd:auth): authentication failure; logname= uid=0 euid=0 tty=ssh ruser= rhost=192.168.66.66 user=bar
And you want them to look like this (pardon the formatting):
Use this Splunk query:
index="Linux" process="sshd" | stats count values(rhost) values(host) by user | lookup dnslookup clientip as values(rhost) OUTPUT clienthost as Source_Hostname | table user,values(rhost),Source_Hostname,values(host)
Let's break this down:
index="Linux" - Searches my index known was Linux.
process="sshd" - Looks at the field process and only grabs events from the sshd process.
stats count values(rhost) values(host) by user - By using the values command, I can see all of the (plural) hosts the user attempted to connect from AND all of the hosts they failed to connect to.
lookup dnslookup clientip as values(rhost) OUTPUT clienthost as Source_Hostname - Using the lookup dnslookup function, I can have Splunk automatically perform a DNS lookup on the source host. This is good for reporting/alerting; it is easier to read "John's Mac" instead of "192.168.66.67".
table user,values(rhost),Source_Hostname,values(host) - The table spits out the user, all of the source host(s) they attempted to connect from, the DNS name of those host(s), and the hosts the user attempted to connect to.
Got a better way of doing it? Please share in the comments!
Thursday, October 18, 2012
Shm00 Splunk Fu - Part 1
I'm going to start writing a series on Splunk Fu and how to use it to detect malicious/nefarious activity within your network.
The structure will vary.
I am not going to write a tutorial on installing Splunk, there are plenty of those online.
I'm going to give you specific examples for dashboards and alerts that you can create for your own environment.
Today's example will be creating a query for detecting new services that are installed on a machine.
Why is this useful?
Then, I create an additional dashboard panel that gives me the details of the installed services.
My XML for this panel looks like this:
In the next post we will talk about using lookup lists.
The structure will vary.
I am not going to write a tutorial on installing Splunk, there are plenty of those online.
I'm going to give you specific examples for dashboards and alerts that you can create for your own environment.
Today's example will be creating a query for detecting new services that are installed on a machine.
Why is this useful?
- If you have a Systems Engineering team, they *should* know what is being installed on the servers.
- If something gets installed and they don't know what it is, it could be malicious.
- If it is not malicious, it could simply be unintentional, which is another problem.
- You can detect if malware is being installed on multiple machines, and stop a small problem from turning into a big problem.
- After a certain sample size, you can compile a pseudo-white list of approved services, so you gain a better understand of what actually exists on your servers and network.
How do I prepare?
- Splunk needs to be on all servers.
- GPO settings for Advanced Auditing needs to be enabled for "Security System Extension" so that Event ID 4697 is being logged by the Windows Servers.
- Install a driver on the machine and verify within Windows Event Viewer that a message "A service was installed in the system." is populated.
I am going to show you the way I do this, you can craft your own that works within your environment.
First, I create a button that will indicate the number of services installed, and will change colors depending on the severity.
First, I create a button that will indicate the number of services installed, and will change colors depending on the severity.
If this is not lighting up, I don't even have to think about services being installed.
You create this panel within a dashboard by utilizing the "Single" function w/in Splunk's dashboard XML.
My XML looks like this:
<row><single><searchString>index="Windows" sourcetype=WinEventLog:System "Message=A service was installed in the system." | stats count by Service_File_Name | stats sum(count) as total_count | fillnull value=0 AS total_count | rangemap field=total_count low=0-0 elevated=1-3 severe=4-10000</searchString><title>Number of unauthorized services installed</title><earliestTime>-24h@h</earliestTime><latestTime>now</latestTime><option name="afterLabel">services.</option><option name="beforeLabel"/><option name="charting.chart.nullValueMode">gaps</option><option name="charting.chart.rangeValues">[0,1,5,100]</option><option name="charting.chart.stackMode">default</option><option name="charting.chart.style">minimal</option><option name="charting.gaugeColors">[0x84e900,0xffe800,0xbf3030]</option><option name="charting.layout.splitSeries">false</option><option name="charting.legend.placement">right</option><option name="charting.secondaryAxis.maximumNumber">""</option><option name="charting.secondaryAxis.minimumNumber">""</option><option name="charting.secondaryAxis.scale">""</option><option name="classField">range</option><option name="count">50</option><option name="displayRowNumbers">true</option></single></row>
Then, I create an additional dashboard panel that gives me the details of the installed services.
| Click to View Larger Image |
My XML for this panel looks like this:
<row><table><searchString>index="Windows" sourcetype=WinEventLog:System "Message=A service was installed in the system." | table _time, User, Service_File_Name, host, Message</searchString><title>Detailed view of unauthorized services installed .</title><earliestTime>-24h@h</earliestTime><latestTime>now</latestTime><option name="charting.axisTitleX.text">File Name</option><option name="charting.chart.rangeValues">[-1,0,1,15]</option><option name="charting.gaugeColors">[0x84e900,0xffe800,0xbf3030]</option><option name="charting.primaryAxisTitle.text"/><option name="count">10</option><option name="dataOverlayMode">highlow</option><option name="displayRowNumbers">true</option></table></row>
In the next post we will talk about using lookup lists.
Wednesday, October 17, 2012
Subscribe to:
Comments (Atom)
